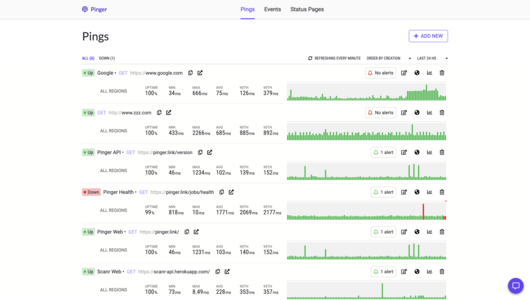


Monitor any HTTP Endpoint
Get a clear overview of all the monitored websites and APIs URLs. See the uptime, mean response time, minimum, maximum and percentiles over the past day, week, or month to get an idea of their health.
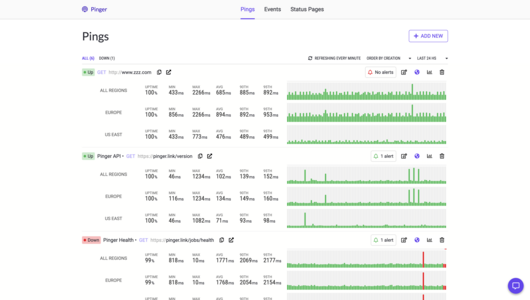
Multi Region
Monitor your services from the United States and Europe (more regions to come!), and get detailed per region uptime information and metrics.
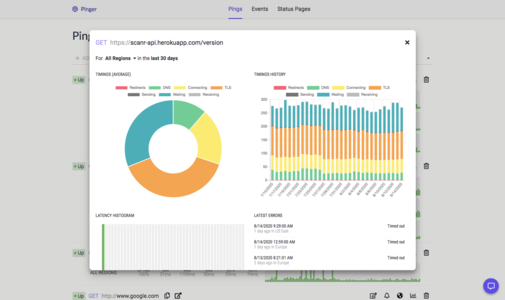
Detailed Metrics and Charts
Get detailed chart information like latency histogram, last month latency heatmap, and more to come.
E-mail, Slack and Webhooks Alerts
This feature is still under construction.
Public Status Pages
This feature is still under construction.
Region Availability
The available application locations for this add-on are shown below, and depend on whether the application is deployed to a Common Runtime region or Private Space. Learn More
- Common Runtime
- Private Spaces
| Region | Available |
|---|---|
| United States | |
| Europe |

| Region | Available | Installable in Space |
|---|---|---|
| Dublin | ||
| Frankfurt | ||
| London | ||
| Montreal | ||
| Mumbai | ||
| Oregon | ||
| Singapore | ||
| Sydney | ||
| Tokyo | ||
| Virginia |

Plans & Pricing
-
- Number of Pings 1
- Multi Region
- Unlimited Collaborators
- Status Pages 0
- Data Retention (days) 30
This add-on is in alpha and can only be provisioned if you have been invited by this add-on partner. To provision, copy the snippet into your CLI.
Documentation
View add-on docs on DevCenter